
Base maps
The base map helps you locate roads, buildings and fields. It is contextual mapping; it does not itself prove a planning designation or ownership.
Map help and evidence guide
The map brings together planning, environment, heritage, transport and community information relevant to Betchton Parish. It is an evidence-exploration tool for the Neighbourhood Plan: useful for finding patterns and questions, but not a substitute for checking the current official source before a formal decision.
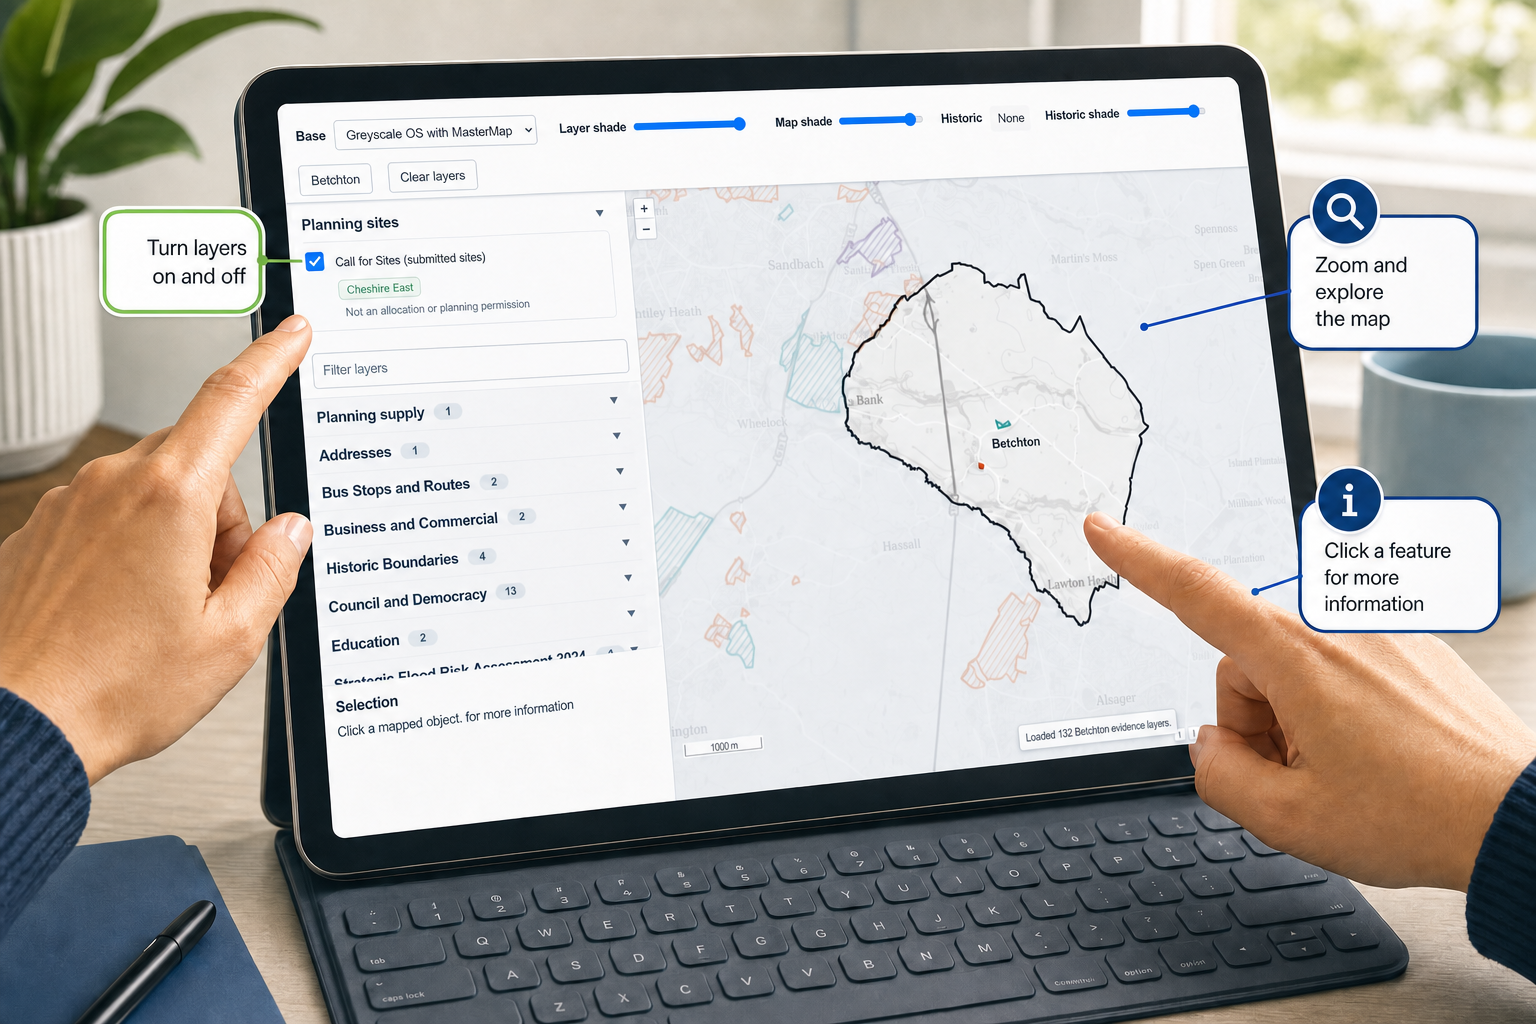
Quick start
Start with one or two layers. Too many overlapping layers can hide patterns and make the map harder to interpret.
Use Base for greyscale, colour or aerial mapping. Greyscale usually makes evidence layers easiest to see.
Open a category in the left panel or use Filter layers. Tick the box beside a layer to display it.
Use the shade controls to see the base map through polygons. Turn layers off between comparisons.
The selection panel explains what the object is, where the record came from and any recorded limitations.
Open the source link and check its date, status and coverage before citing a feature in policy, a representation or a planning decision.
The base map helps you locate roads, buildings and fields. It is contextual mapping; it does not itself prove a planning designation or ownership.
This overlay is requested directly from the Opus service used for Cheshire East's current published site submissions map whenever the Betchton map is viewed. It includes the 2024 and 2026 submissions and withdrawn sites (shown in grey). The council's published layer list is checked every six hours. A submitted or displayed site is not the same as an allocation or planning permission.
Layers marked Live now request current map imagery directly from Cheshire East whenever they are displayed. Click a mapped item for the council's live feature information. A six-hour checked local copy is retained as a fallback.
Compare tithe, historic Ordnance Survey and aerial layers. Dates describe the source imagery or map edition; boundaries may not align exactly with modern mapping.
Layer shade changes the selected evidence; Map shade changes the base; Historic shade changes the chosen historic layer.
When signed in, working drawing layers appear first in the left layer chooser. Every authorised user receives a personal working layer with a different initial colour. Viewers may view shared layers but cannot alter layers or polygons. Editors can draw and manage only layers they own; they cannot edit another editor's or an administrator's work. Editors can keep a layer private to themselves and administrators while preparing a mock-up, then share it with registered users. A control reveals other users' shared personal layers for comparison. Administrators can manage all layers, change account names, roles, colours and passwords, deactivate accounts, and choose whether to retain or retire layers created by a deleted user. Only administrators can publish a layer publicly. Retired records remain in the audit trail and private database backup. Hovering over a polygon reports its gross area in square metres, hectares and acres, plus a deliberately broad housing indication using 15–30 homes per gross hectare. The upper comparator reflects nearby North Congleton strategic-site evidence at about 30 dwellings per hectare in the adopted Cheshire East Local Plan Strategy; the lower comparator recognises Betchton's dispersed rural form. This does not deduct land for roads, access, drainage, open space, biodiversity, constraints or design and is not a capacity assessment. A working polygon is not an allocation, planning permission, ownership boundary or Parish Council endorsement. Do not put personal data in titles or notes.
Evidence provenance
The map combines public mapping, national datasets, historic records and information obtained through FOI/EIR. Each source answers different questions; none should be treated as complete on its own.
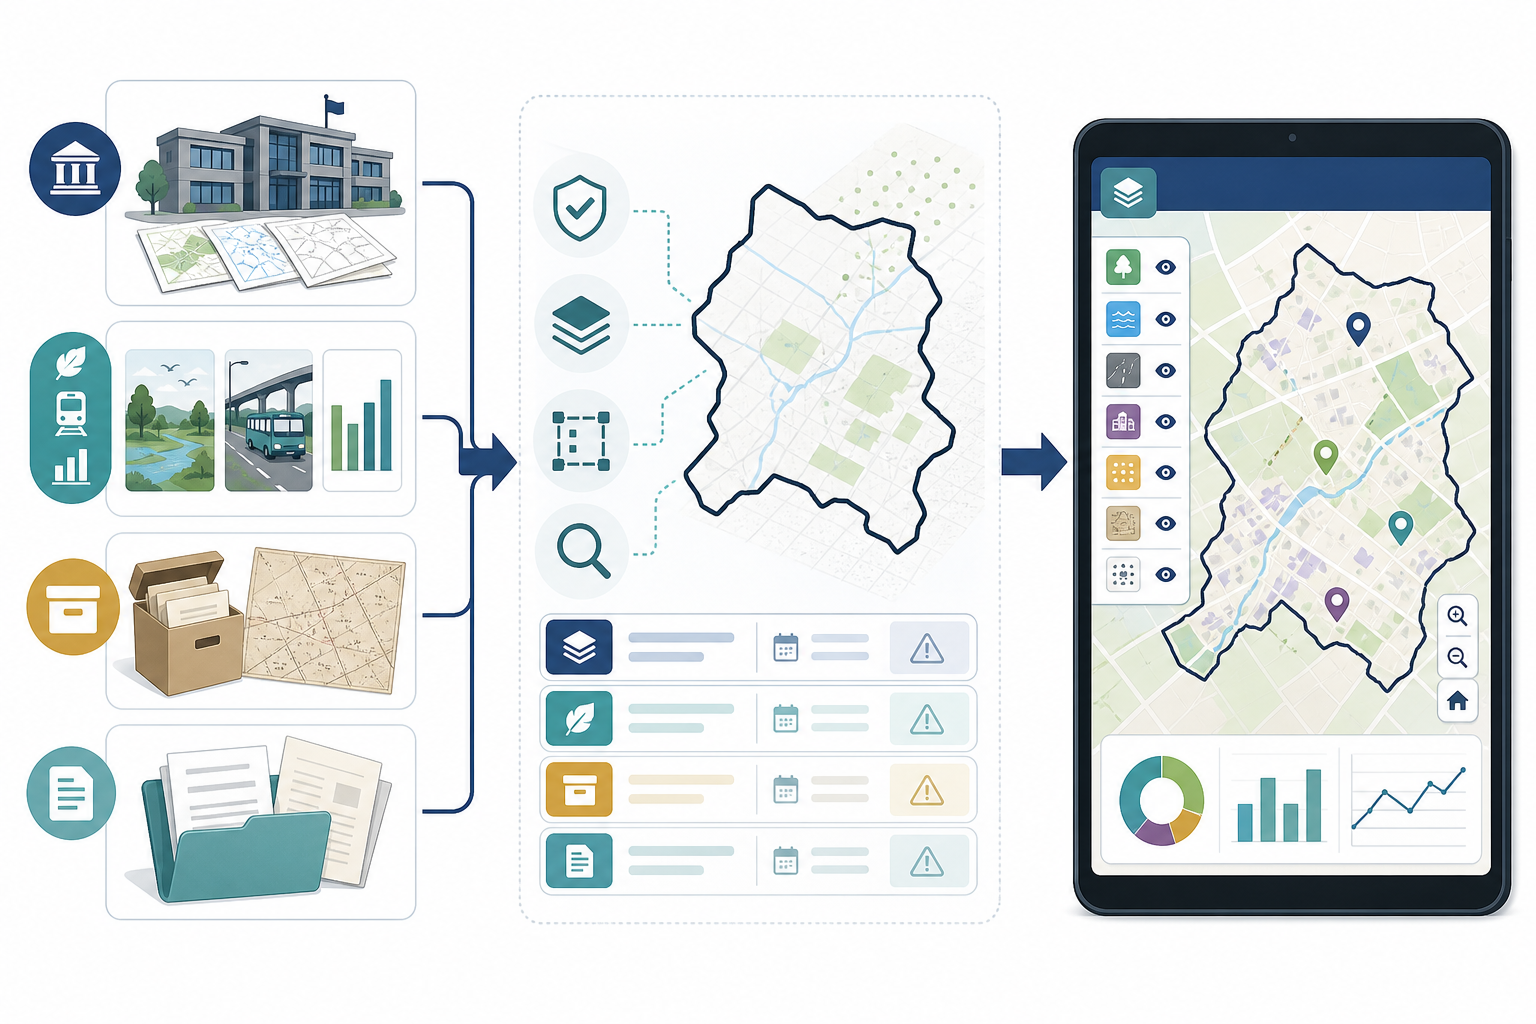
Cheshire East public mapping, national agencies, archives, official reports and FOI/EIR disclosures.
Record the provider, access date, geography, licence or reuse note and known limitations.
Convert technical formats where needed and clip or relate records to the Betchton parish boundary. Approximate locations are labelled.
Compare evidence, identify questions and support neighbourhood-plan research. Recheck the live official source for formal use.
What is in the map
Layers are arranged in coloured subject folders with labelled sub-sections. Open a folder such as Planning, Environment, Transport or Heritage, or type a subject, layer or provider into the layer search box. Colour supports the navigation but folder and section names carry the meaning.
Call for Sites, housing supply, Local Plan and other planning layers help explore possible development context. Status matters: a site may be submitted, emerging, allocated, permitted or completed.
Flood, ecology, natural-environment and nature-recovery layers support screening and cumulative assessment. The allotment/community-growing layer uses a 1 km context because the current OS source records no site inside Betchton but one adjoining site near Sandbach Heath; it does not establish ownership, statutory status, availability or access. Always check current Environment Agency, Natural England, Ordnance Survey and Cheshire East evidence.
Historic Environment Record, APAS, listed-building context and tithe information help identify heritage questions. Tithe ownership and plots are historic, not present-day ownership evidence.
Road, street, bus, winter-service and road-safety records help examine access and movement. Some disclosed incident locations are approximate along named roads.
Addresses, demographics, connectivity, education, business and housing-market layers provide context, often at postcode or statistical-geography level rather than individual-property level.
Electricity layers combine dated public works information and low-confidence public feature leads. They are for evidence discovery and early screening only. Marker positions may be centroids or approximate event locations; they are not SP Energy Networks asset plans, surveyed routes, excavation records or connection offers. Obtain current SPEN/LSBUD plans and a site-specific connection assessment before formal reliance.
The Police.uk layer covers the public anonymised record from December 2010 onwards. Use the separate From and To year sliders in the layer menu to load only the period needed. Points are moved to nearby anonymous locations and must not be treated as an exact address or household. Select a point to see its latest published outcome and, where Police.uk supplies a crime identifier, a readable outcome-history page. Police.uk has republished some Cheshire periods and lists known data issues, so changes in counts may reflect publication coverage as well as recorded crime.
BGS and related layers flag broad ground-condition context. Site investigation and professional interpretation may be needed for a proposal.
Parish, ward, polling and administrative layers help identify geography and responsibility. Historic and current boundary editions should not be confused.
Disclosed records extend the public evidence base. Some are document indexes or processed extracts; read the linked disclosure and the map limitation before relying on them.
Read responsibly
Not land ownership. Map boundaries, postcodes and historic tithe records do not establish current title.
Not a planning decision. A mapped site, constraint or feature does not determine whether development is acceptable.
Not always exact. Postcode centroids, named-road placements and non-spatial index markers may be approximate.
Not every layer is automatically current. Look for “Live now” or “Auto 6-hour”, check the recorded date and follow the authoritative source before formal use.
Exact layer help
Every selectable map layer is listed with its record count, source, refresh method, processing note and limitation where these are recorded. The Info control beside a map checkbox opens this directory at the matching layer.
Maintenance
Interface changes and evidence-data integrations are recorded separately.
Loading update history...